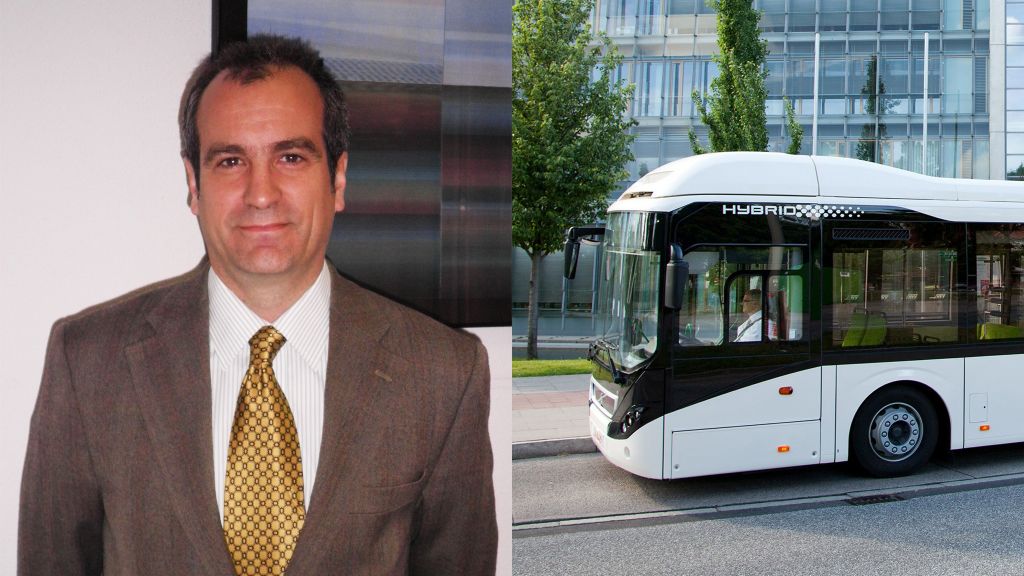
University study highlights full hybrid technology benefits


What was the aim of the study?
“We understood from Volvo Buses that there is some confusion surrounding the differences between full and mild hybrid bus technology from an environmental perspective. The objective was to therefore measure and compare the carbon emissions of two city hybrid buses – one with mild and one with full hybrid technology – in a controlled environment. To do this, we followed the International Association of Public Transport’s (UITP) standardised SORT 1 (‘heavy urban’) and SORT 2 (‘easy urban’) driving cycles as requested by Volvo Buses. We also assessed the noise emissions of both vehicles.”
How did you collaborate with Volvo Buses?
“The study was requested by Volvo Buses Spain. There are a substantial number of hybrid buses in Spain and in Europe, so it is important to understand the differences between the two technologies, especially for operators who want to decrease their carbon footprint. To highlight the differences, Volvo Buses Spain felt it was important to conduct a credible and independent scientific study and that’s why they approached us. To remain impartial, they were not involved in the actual assessment.”
How was the assessment conducted?
“The UITP tests took place on a three-kilometre circular test track. For the heavy urban bus cycle, the average speed was 12.1 km/h with 5.8 stops per kilometre. The easy urban test was designed to represent a city bus cycle with an average speed of 18 km/h and 3.3 stops per kilometre as an average. To avoid a cold start, both buses did two laps of the track before we started the tests. The carbon emissions were measured, compared and verified using the UITP methodology for determining the fuel consumption of urban buses under standardised test cycles. We measured the noise emissions by using a sound meter as the buses passed by in accordance with the United Nations Economic Commission for Europe (UNECE) regulation requirements.”
The overall outcome was very clear – the use of full hybrid bus technology results in a significantly lower environmental impact than mild hybrid bus technology.
How did you ensure a fair comparison of the mild and full hybrid technologies?
“We used the same driver, speed, vehicle load, driving pattern and test track under the same climate conditions. Both vehicles also had comparable chassis, tyres and bodies. Everything was recorded so we could monitor what was happening during the tests. Even the personnel onboard the buses were weighed to ensure the same load! The driver could also see the driving pattern, as well as the desired and actual speed of the vehicle, on a screen at all times. The sound measurements were conducted on a special noise track used for this purpose to ensure the same parameters were in place for both vehicles. To be clear, the bus models used were not relevant to the study. The aim was to compare the technologies. Therefore we avoided vehicle model identification as much as possible.”
What were the results and what conclusions can be made about full hybrid buses?
“The carbon emissions of the mild hybrid vehicle were higher in both cycles – by 22% in the heavy urban test, and by 33% in the easy urban test. The noise emissions of the mild hybrid vehicle were also four decibels higher at 77 db than the full hybrid at 73 db. It was a great result for the full hybrid, although the research team were not surprised by the outcome! Full hybrid technology has a more powerful electric machine that can propel the bus for longer. It is also able to recover energy from braking manoeuvres and use it to drive in pure electric mode. This combination leads to reductions in both carbon and noise emissions. The overall outcome was very clear – the use of full hybrid bus technology results in a significantly lower environmental impact than mild hybrid bus technology.”