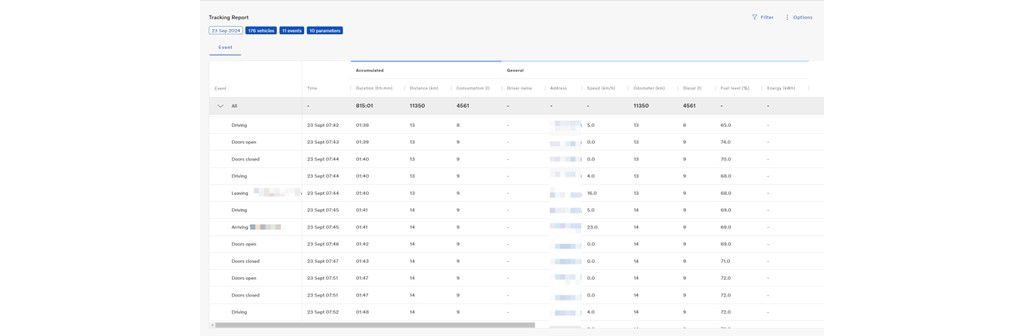
Previously, the Excel export was limited to 3000 events. With this release, we are removing that limitation, allowing you to export all the data you need. Whether you want to analyze it in the portal or in Excel, you can now load and export as many rows as you require.
Select all vehicles in the same report
Before, the maximum amount of vehicles in the report was 200. Now, we have added the ability to select all vehicles in your fleet in the report. This makes it easier for you to gather data and events for your entire fleet, simplifying your analysis process.
Improved user interface
We have given the Tracking Report a fresh new design. One of the key improvements is the ability to change column sizes. This feature is particularly useful when tracking events with long names, as it allows you to adjust the column widths for better visibility.
We have also introduced new "Select all" and "Clear all" buttons in the filter section. These buttons make it even easier for you to select and filter the data you need, streamlining your analysis workflow.
Trip View for Individual Vehicles
Just like in the previous version of the report, when you search for data for a single vehicle, you will find the option to view trips aggregated over time with ignition on. This feature allows you to analyze specific vehicle behavior and patterns.
What is the Tracking Report?
The Tracking Report provides timestamped vehicle events, including information such as door openings, excessive idling, vehicle start times, and entering and leaving zones. Each event provides detailed information such as the vehicle's address, battery voltage, speed, temperature, driver, and more.
To access the Tracking Report, simply open the Report tool and select Tracking Report from the menu.
Please note the following additional information